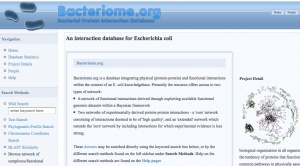
Bacteriome
You can help EcoliWiki by editing the content of this page. For information about becoming a registered user and obtaining editing privileges, see Help:Accounts.
See Help:Databases for more information about databases in EcoliWiki.
<protect>
| Link/URL: | |
|---|---|
| What: |
An integrated protein interaction database for E. coli. Bacteriome features a high quality functional interaction dataset of E. coli proteins togther with experimental datasets generated through tandem affinity purification screens. |
| Who: |
Parkinson Lab together with Andrew Emili and Jack Greenblatt |
| Updates: | |
| Upcoming events: | |
| Web Services: |
|
| edit table |
</protect>
Contents
About Bacteriome
Bacteriome.org is a database integrating physical (protein-protein) and functional interactions within the context of an E. coli knowledgebase [1].
Content
Bacteriome offers access to two types of network:
1) A network of ~4,000 high quality functional interactions derived through exploiting available functional genomic datasets within a Bayesian framework [2]. Interactions were generated from the integration of ten genome scale datasets and are predicted to be of equivalent quality to small scale experimental pull down experiments. See preceding reference and its supplementary data for further information on its validation and how it compares to equivalent datasets.
2) Two networks of experimentally derived protein-protein interactions - a 'core' network consisting of interactions deemed to be of 'high quality'; and an 'extended' network which extends the 'core' network by including interactions for which experimental evidence is less strong [3]. Note these experimental datasets do not correlate precisely with the experimental datasets described in the PLoS Biology reference. The datasets described in the PLoS Biology paper were subjected to a seperate and unrelated Bayesian integration exercise.
The Bacteriome website, offers the user the ability to select groups of proteins on the basis of simple text searches (e.g. 'kinase'), domian composition, functional and evolutionary relationships. Selected proteins and their interactions may then be visualised using a customized Java based applet. Unlike similar resources, Bacteriome allows the layering of meta-data within these interaction datasets - including the visualization of domain architectures and their phylogenetic profiles. Furthermore, clustering of protein interaction data using the robust algorithm - MCL, allows the proteins to be placed within discrete functional modules representing for example protein complexes or biochemical pathways. Again, a Java-based ap[plet is available for visualization and exploration of this modular representation of the E. coli proteome.
Alternatively the interaction datasets are also available for download without restriction.
Using Bacteriome
Searching
The data in Bacteriome can be browsed through several distinct mechansisms:
1) Global protein view. The user can use a Java applet to display the modular organization of the data and select discrete functional modules for more in depth visualization of their components. 2) BLAST similarity searches. Bacteriome features a fully functional BLAST server, that allows users to identify significant sequence similarity matches to their protein of interest. 3) Gene names. Users can simply search for their favourite gene of interest. 4) Keyword search. Users can enter text refering to functional or domain based information (e.g. 'kinase' or 'ribosomal protein') to derive proteins of interest. 5) Phylogenetic profiles. Users can select proteins on the basis of their evolutionary history.
After the search, the user is provided with detailed descriptions of the proteins of interest, from which they may select groups of proteins for network visualization using the customized Java applet. The Java applet allows users to extend the interactions of interest and also to map on features of interest (e.g. protein domain architectures).
Usage examples
Three examples of interaction views generated by the bacteriome website. From left to right: 1) Standard protein network view, colours of nodes represent COG functional categories, size represent selected proteins; 2) Complex network view, pie charts represent breakdown of COG functional categories of componjebnt proteins, size represent the number of proteins in the complex; 3) Phylogenetic profile view, nodes represent individual proteins, the coloured sectors represent the presence of a detectable homolog across ~200 different species.
STRING database of protein-protein interactions
References
See Help:References for how to manage references in EcoliWiki.
- ↑ Su, C et al. (2008) Bacteriome.org--an integrated protein interaction database for E. coli. Nucleic Acids Res. 36 D632-6 PubMed
- ↑ Peregrín-Alvarez, JM et al. (2009) The Modular Organization of Protein Interactions in Escherichia coli. PLoS Comput. Biol. 5 e1000523 PubMed
- ↑ Hu, P et al. (2009) Global functional atlas of Escherichia coli encompassing previously uncharacterized proteins. PLoS Biol. 7 e96 PubMed
External Links
Bacteriome web site http://www.bacteriome.org
Parkinson lab web site http://www.compsysbio.org/lab

